
Microsoft Teams Phone handles the calls themselves. VoiceQ365 makes the environment around them visible, manageable and measurable.
The Realtime Dashboard is the area that shows the state right now: how many are waiting in a queue, how long the wait is, and who is present to take it.
The three areas of VoiceQ365
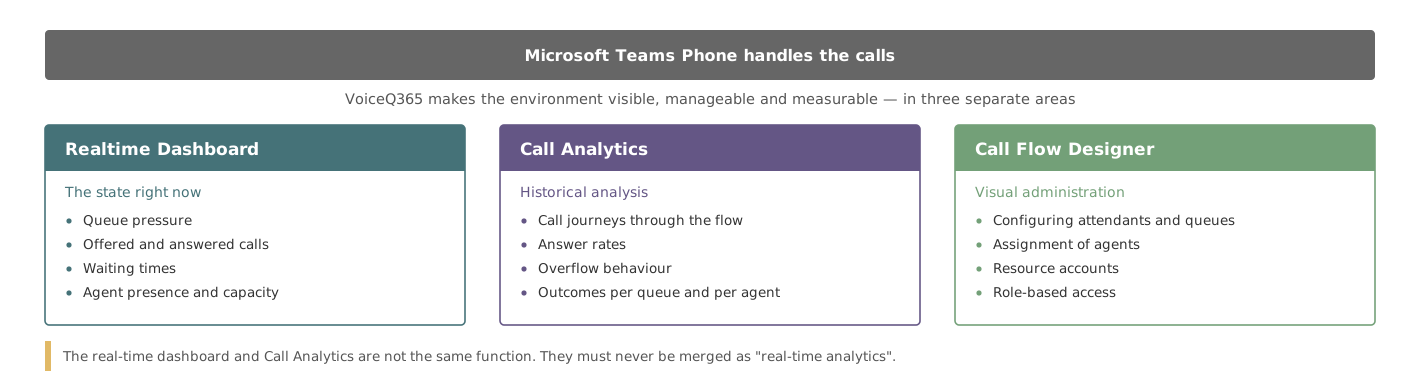
| Area | What it is |
|---|---|
| Realtime Dashboard | Current operational state — queue pressure, offered and answered calls, waiting times, agent presence and capacity. |
| Call Analytics | Historical analysis — call journeys through the flow, answer rates, overflow behaviour, outcomes per queue and per agent. |
| Call Flow Designer | Visual administration — configuring auto attendants and queues, assigning agents and resource accounts, role-based access. |
The three must be kept apart. The Realtime Dashboard and Call Analytics are not the same function, and the phrase "real-time analytics" does not describe anything the product does.
How to get in
- Sign in to Coherence.
- Choose VoiceQ365 in the top menu.
- You get two tiles. Click the one on the right — Realtime Dashboard, Agent presence and call statistics.
The dashboard is read-only
There are no editable fields in the view. You cannot change an agent's presence or a queue's configuration from here — that happens in Call Flow Designer or in Microsoft Teams. The only thing you control is what the dashboard shows you.
Next relevant articles
- How to read the overview — understand the three tiles and the key figures.
- Layouts and settings — choose the queues, agents and charts shown in your view.