
| Report | Source | Key metrics | Default period |
|---|---|---|---|
| Direct Routing | SBC call detail records | 5 | Last 31 days |
| Operator Connect | Operator-delivered call records | 5 | Last 31 days |
| AA & CQ | Auto attendant and call queue analytics | 8 | Whole period |
| Call quality (CQD) | Microsoft Call Quality Dashboard telemetry | 4 | Whole period |
The differing default periods are a genuine trap. Numbers quoted from AA & CQ and from Direct Routing in the same conversation are, unless somebody changed the period, covering completely different spans of time.
Direct Routing
Traffic crossing your own session border controllers. Five key metrics: incoming and outgoing call counts, incoming and outgoing durations, and average talk time.
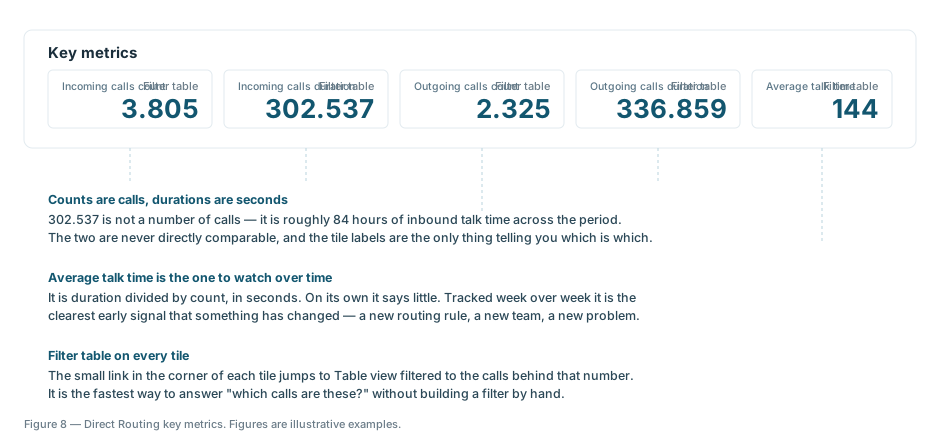
Two of those are counts of calls and two are durations in seconds, which is the most common misreading in the whole product. An incoming calls duration of 302,537 is roughly 84 hours of talk time, not three hundred thousand calls.
Average talk time is duration divided by count. On its own it says little; tracked week over week it is the clearest early signal that something has changed — a new routing rule, a new team, or a new problem.
Operator Connect
The same five metrics, for numbers delivered through an operator rather than your own trunks. The difference is how it labels traffic: raw codes rather than plain English.
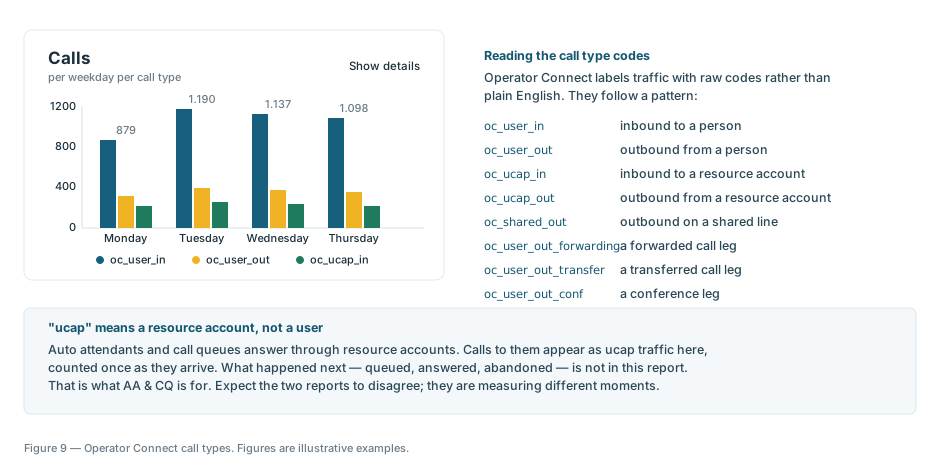
| Code | Meaning |
|---|---|
oc_user_in | Inbound to a person |
oc_user_out | Outbound from a person |
oc_ucap_in | Inbound to a resource account |
oc_ucap_out | Outbound from a resource account |
oc_shared_out | Outbound on a shared line |
oc_user_out_forwarding | A forwarded call leg |
oc_user_out_transfer | A transferred call leg |
oc_user_out_conf | A conference leg |
ucap denotes a resource account — the account behind an auto attendant or call queue — rather than a person.
AA & CQ
Auto attendants and call queues: what happened to the people who called your menus and queues. Eight key metrics, split between inventory and outcome.
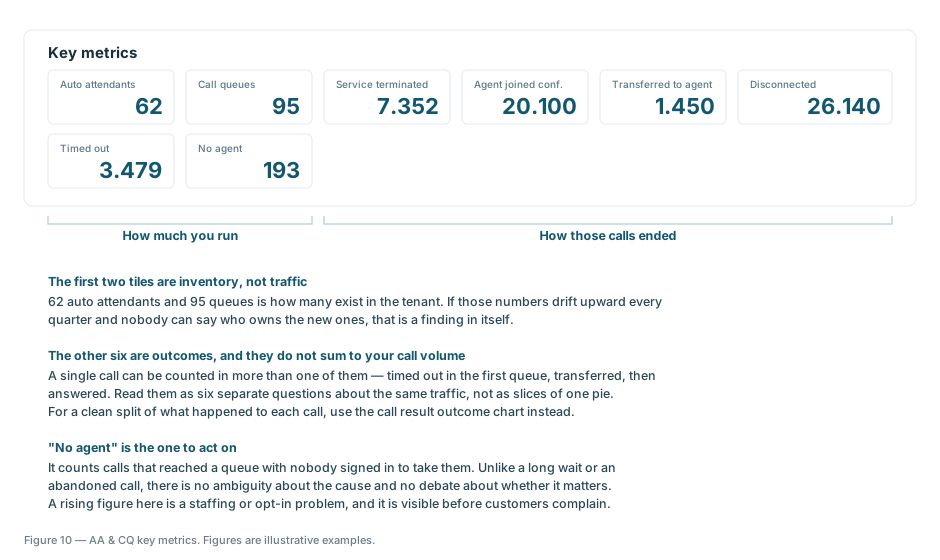
The first two tiles — auto attendants and call queues — count how many exist in the tenant. The other six describe outcomes, and they do not sum to your call volume: one call can be counted in several as it moves through the routing tree. For a clean split that classifies each call exactly once, use the call result outcome chart.
For what those outcomes mean in practice, see Reading your call queues.
Why the reports disagree
This is the question that generates the most support tickets, and the answer is simple once stated: they measure different moments in a call's life.
A call arriving at a queue is counted once in Operator Connect or Direct Routing, as it arrives. What happened next — queued, transferred, answered, abandoned — belongs to AA & CQ. Neither is wrong. They are answering different questions, and their totals should not be expected to match.
Call quality (CQD)
Whether the calls you did handle actually sounded acceptable. This report draws on Microsoft's own telemetry rather than on call records.
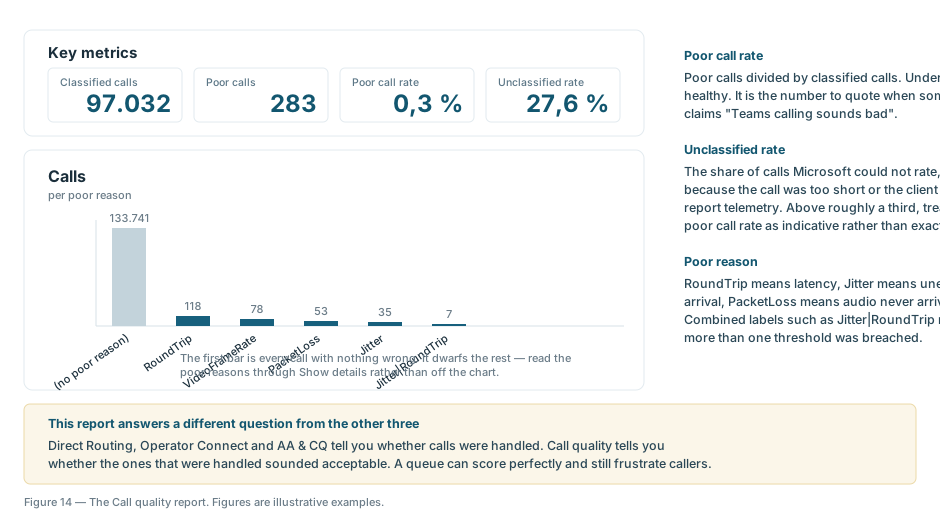
Poor call rate is poor calls divided by classified calls. Under 1% is healthy. It is the number to quote when someone claims "Teams calling sounds bad".
Unclassified rate is the share Microsoft could not rate at all, usually because the call was too short or the client reported no telemetry. Where this exceeds roughly a third, treat the poor call rate as indicative rather than exact — otherwise you are quoting a percentage of an unknown denominator.
Poor reason maps to network conditions: RoundTrip is latency, Jitter is uneven arrival, PacketLoss is audio that never arrived. Combined labels such as Jitter|RoundTrip mean more than one threshold was breached on the same call.
A queue can score perfectly on outcome and still frustrate callers. Call quality is the report that tells you so.