
For service and operations managers
See queue pressure now — analyse performance afterwards
Use Real-Time Dashboard for current operations and Call Analytics for historical patterns, waiting times and call outcomes.
Two different decisions
Current operations and historical analysis must remain separate
Both areas are available in VoiceQ365, but they answer different operational questions.
Real-Time Dashboard
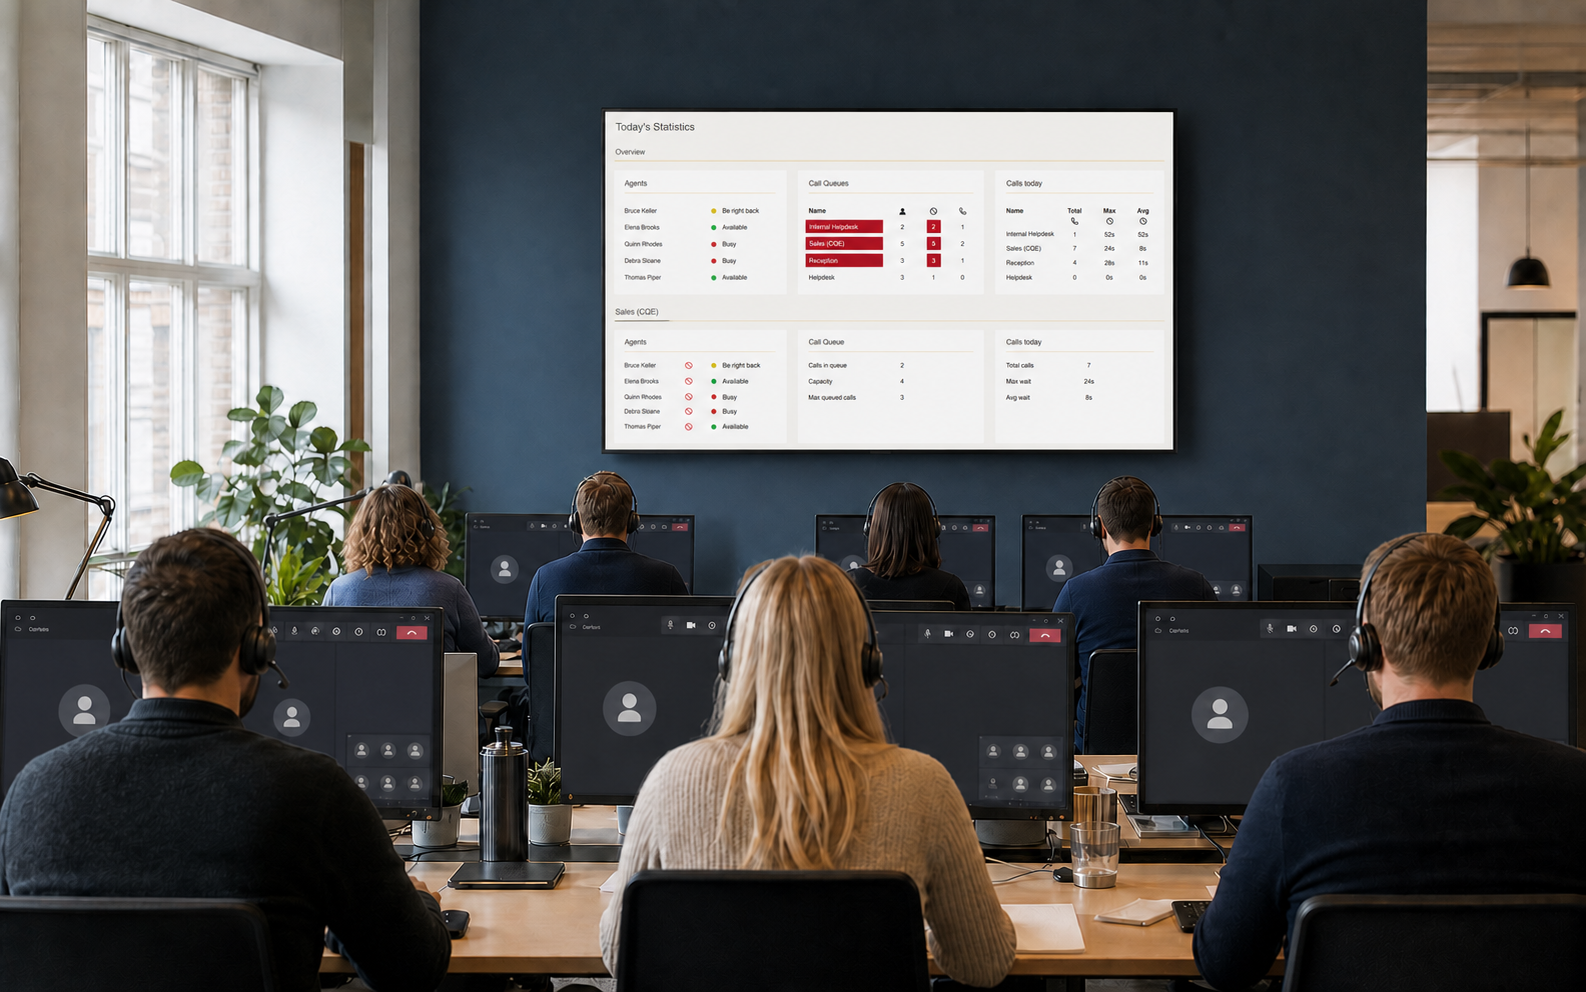
Monitor current queue activity, waiting times, agent availability and operational pressure.
See the dashboard →Call Analytics
Analyse historical calls, waiting times, answered and lost calls, and overflow over time.
See Call Analytics →Call Flow Designer
See and administer the call flows that route calls through auto attendants and call queues.
See Call Flow Designer →Right now
Which call queues require attention?
Real-Time Dashboard shows the current situation for queues, waiting times and agent availability.
See Real-Time DashboardOver time
Where do waiting time, lost calls and overflow occur?
Call Analytics uses historical data to analyse call outcomes and trends.
See Call AnalyticsNext step
Bring your operational questions to the demo
We show the difference between current operational monitoring and historical analysis based on the KPIs you follow.